Visual Language is a Powerful Tool for Storytelling in the World of Business
Visual language makes data easier to understand because our human brains process visuals 60,000 times faster than they do text. Science has known since 1921 that “a picture tells a thousand words.” Therefore, it makes sense that applying visual language storytelling in the business world will yield powerful results to help companies grow better.
My Story Arc
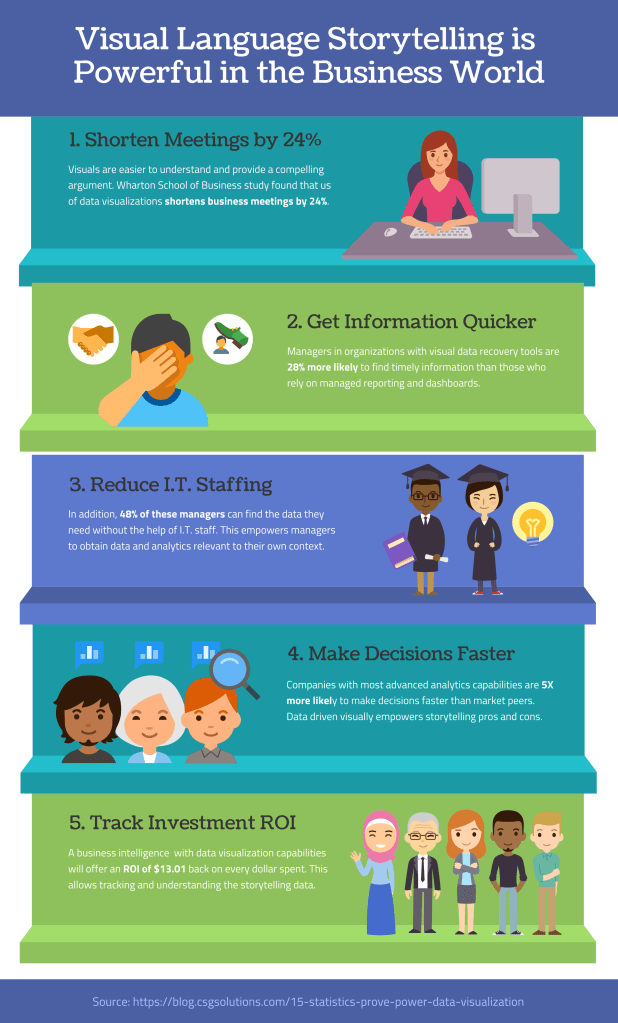
The story arc for my infographic is based on a blog about data visualization tools. My infographic shows how businesses are empowered through data storytelling to grow revenues and concurrently reduce their investments of time, human resources, and dollars in operational processes.
The first step, or beginning, is to use visual data storytelling to free up staff hours by reducing time in meetings because the visuals are more quickly understood (1). The middle of the story arc is empowering managers to get real-time information directly through visual language driven platforms (2); this will reduce I.T. time on manually sourcing lagging data (3); management will be empowered with confidence of real-time data to make decisions faster (4). At the end, investment in tools for data visualization storytelling to inform business operations will have a positive return on investment (ROI) by a trackable dollar amount of reduced overhead (5).
Takeaways
One of my biggest takeaways is the importance of playing to our brain’s strengths so to speak. Not only does the human brain process visuals 60,000 times faster than it does text, but 90% of the information that is transmitted to the brain is visual. For all types of education or information transmission, whether in the business or personal context, we should first think about how we can use visual storytelling. And of course, the most effective solutions will involve digital. As we move forward, the opportunities for digital storytelling will be unlimited.