My infographic is describing The Story Spine , a storytelling method which our class learned about in Module 2 of this course. For those of you just like me wondering what an infographic is, here’s the definition from our pal Google:
infographic [ˌinfōˈɡrafik] NOUN
a visual image such as a chart or diagram used to represent information or data.”a good infographic is worth a thousand words” · “complicated scientific information can be made more accessible by using infographics”
My infographic on The Story Spine is below. I created it using a free template on Canva, well free if I remember to cancel my 30 day trial within 30 days or they will charge my MasterCard 🙂
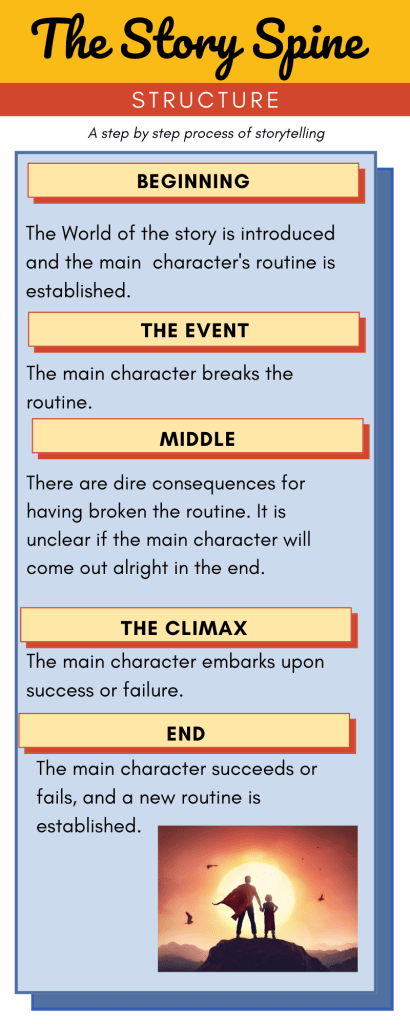
It put things so simply by breaking down the structure of a story and it’s function. The Story Spine is; Once upon a time….Every day…..But, one day…Because of that….Because of that….Because of that….Until Finally…. And, ever since then….
Consider your favorite story, if you trim the fat and filler you’ll find that what you’re left with are the bones of the story, the spine. I did this in my first class blog using a favorite story of mine, National Lampoons Christmas Vacation.
I liked using this tool and will look for occasions to use it again in the future!
The End.
